On 25 October 2023, Frasers Centrepoint Trust (“FCT”) have announced their full year results for the financial year FY2023. Overall, there are no surprises from FCT, and they have remained stable with DPU relatively unchanged given the higher finance costs. There will be slight disruptions from Tampines 1 due to AEI works but is expected to complete before the end of 2024.
Website: Financial Statements And Related Announcement::Full Yearly Results
Background
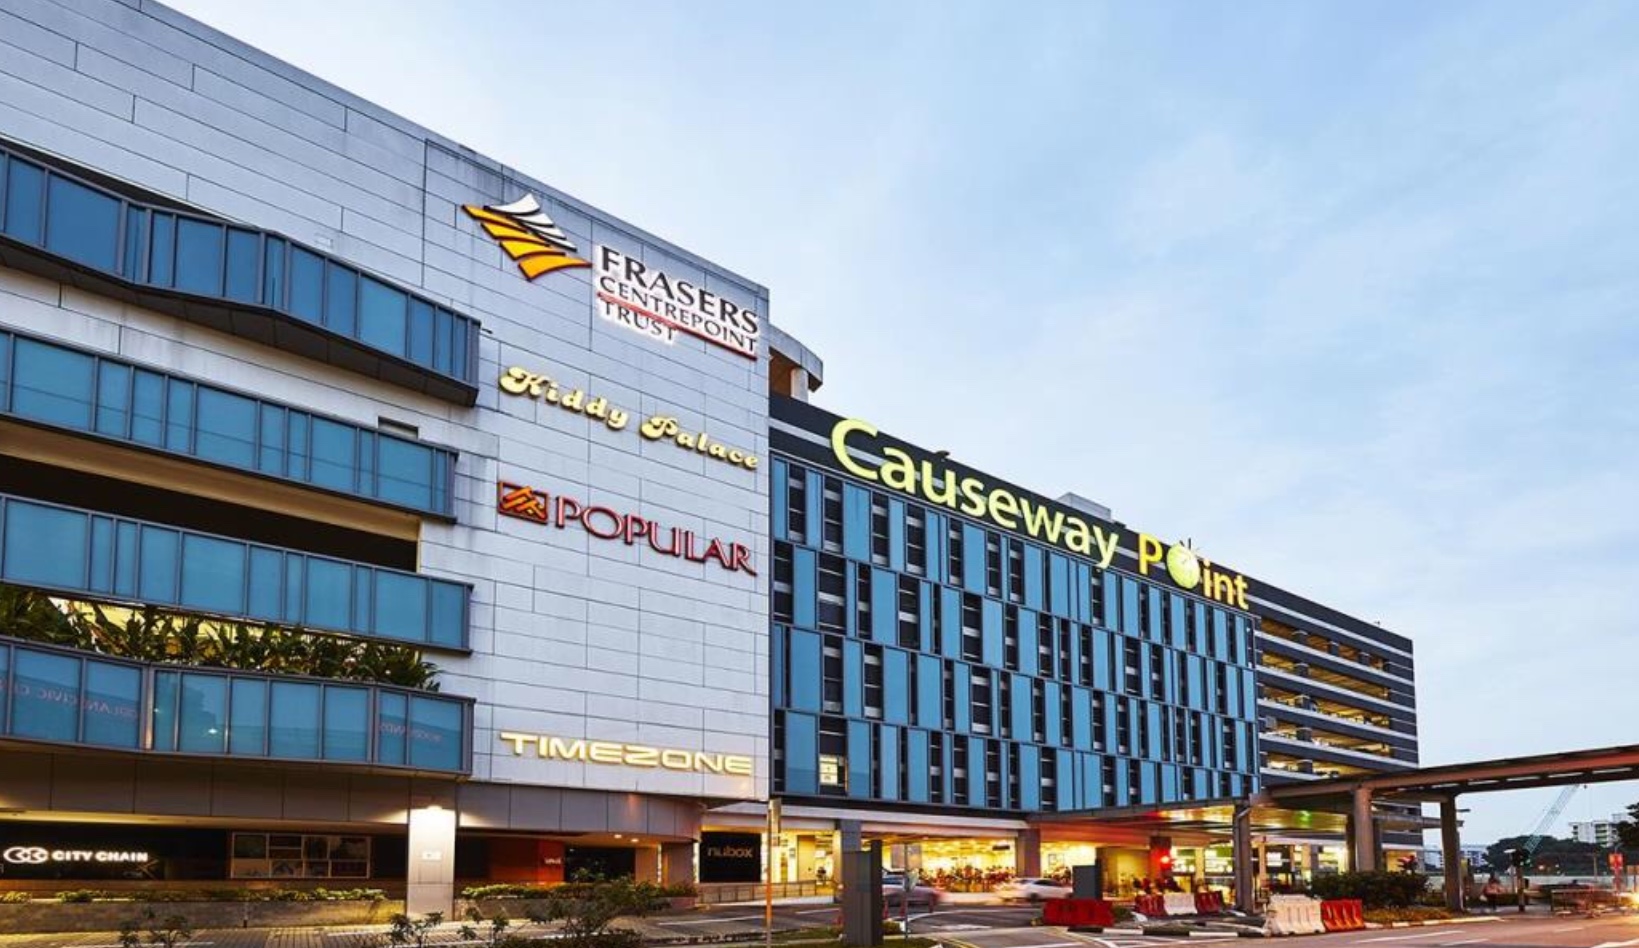
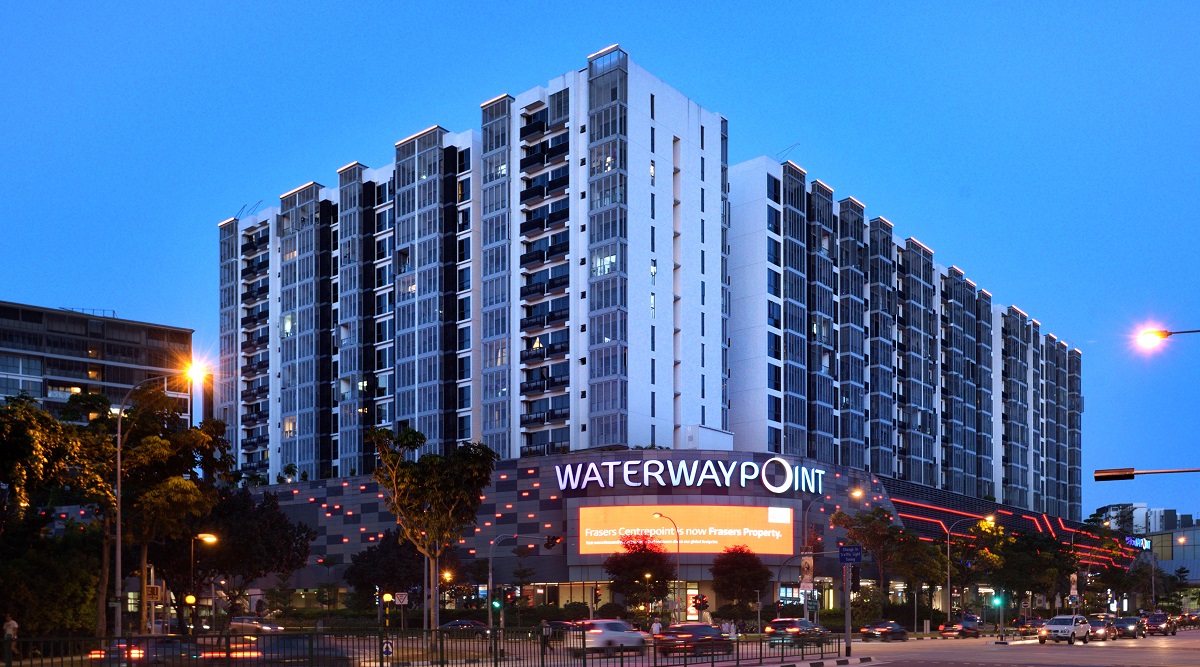
FCT is a leading developer-sponsored REIT and one of the largest suburban retail mall owners in Singapore. FCT’s property portfolio comprises nine retail malls and an office building located in the suburban regions of Singapore, near homes and within minutes to transportation amenities.
FCT is among the top-ten largest Singapore REITs (“S-REITs”) by market capitalization. It is also an index constituent of several benchmark indices including the FTSE EPRA/NAREIT Global Real Estate Index Series (Global Developed Index), FTSE ST Real Estate Investment Trust Index, MSCI Singapore Small Cap Index and the SGX iEdge S-REIT Leaders Index.
Listed on the Main Board of the Singapore Exchange Securities Trading Limited since 5 July 2006, FCT is managed by Frasers Centrepoint Asset Management Ltd., a real estate management company and a wholly-owned subsidiary of Frasers Property Limited.
Key Metrics
Distribution Per Unit (“DPU”)
| Metrics | Current | Previous |
|---|---|---|
| Distribution Per Unit | -0.6% | No Info |
DPU for the full financial year FY2023 have decreased by 0.6% when compared to FY2022. Worth noting that the net property income has actually increased by 2.7% during the financial year. However, this has been offset mainly by finance costs which have increased by 73.0% as well which offsets the net property income. Not unexpected given the higher interest rate environment and the metric is is Neutral as DPU have remained relatively unchanged.
Occupancy
| Metrics | Current | Previous |
|---|---|---|
| Occupancy | 99.7% | 98.7% |
Occupancy rate as at 30 September 2023 stands at 99.7%. This metric is Favorable as it is above my expected healthy occupancy rate of 95%.
Gearing ratio
| Metrics | Current | Previous |
|---|---|---|
| Gearing Ratio | 39.3% | 40.2% |
The gearing ratio has decreased to 39.3% as at 30 September 2023, attributable to the slight decrease in borrowings. This to me is considered Neutral.
Interest coverage
| Metrics | Current | Previous |
|---|---|---|
| Interest Coverage | 3.4x | 3.8x |
The interest coverage for the trailing 12 months stands at 3.4 times, a decrease from 3.8 times in the previous quarter. This is Unfavorable in my opinion but is not unexpected as other REITs are also seeing a decreasing interest coverage in the current interest rate climate. It has also worsened with the new debt financing taken up by FCT to purchase the new assets, as the debt is taken in the current high interest rate environment.
The Federal Reserve on 7 November 2023 have indicated that interest rates need to stay high for a longer period of time and higher interest rates may be needed. This was after having increased the interest rates to a range between 5.25% and 5.50% on 26 July 2023, the highest level in 22 years. There is a possibility that long-term interest rates may see an increase over the next few months.
Website: US Fed official expects further rate hike needed
I have thus performed a sensitivity analysis using the information as at 30 September 2023:
| Description | Amount (SGD’000) |
|---|---|
| Total Debt | $2,212,000 |
| Debt Not Hedged (%) | 37.0% |
| Debt at Floating Rate Exposed | $818,440 |
| Distributable Income FY2023 | $207,135 |
Interest rate sensitivity analysis as below:
| Change in Interest Rates | Decrease in Distributable Income (SGD’000) | Change as % of FY2023 Distribution |
|---|---|---|
| + 50 bps | -$4,092 | -2.0% |
| + 100 bps | -$8,184 | -4.0% |
| + 150 bps | -$12,277 | -5.9% |
| + 200 bps | -$16,369 | -7.9% |
| + 250 bps | -$20,461 | -9.9% |
| + 300 bps | -$24,553 | -11.9% |
Do note the above is my estimation which may be different from management’s estimation. Nonetheless, if the interest rates were to increase by the basis points above, FCT may experience a fall in DPU accordingly.
Debt maturity profile
| Metrics | Current | Previous |
|---|---|---|
| Debt Maturity Profile | 2.3 years | 2.5 years |
Weighted average term to maturity of their debt stands at 2.3 years as at 30 September 2023. This is Favorable as while they have sufficient time to refinance their debts as they fall due. However it is decreasing and something investors need to take note of next quarter.
Price to Book Ratio
| Metrics | Current | Previous |
|---|---|---|
| Price to Book Ratio | 0.91 | 0.93 |
The Price to Book (“P/B”) ratio currently stands at 0.91. This is computed using the closing share price of SGD2.11 on 10 November 2023 and the net asset value per share of SGD2.32 as at 30 September 2023. The P/B ratio is Favorable.
Other Metrics
Tenant profile
FCT has a well diversified tenant profile with the top 10 customers as at 30 September 2023 only account for about 20.2% of monthly portfolio gross rental income. Furthermore no single tenant accounts for more than 5.8% of FCT’s gross rental income. This is Favorable as FCT will not be too reliant on any single tenant for income.
Dividend Yield
| Year | Yield | Total |
|---|---|---|
| 2023 | 5.76% | SGD 0.122 |
| 2022 | 5.79% | SGD 0.122 |
| 2021 | 5.66% | SGD 0.092 |
| 2020 | 4.35% | SGD 0.122 |
| 2019 | 6.62% | SGD 0.140 |
| 2018 | 5.69% | SGD 0.120 |
With a closing share price of SGD2.11 on 10 November 2023 and dividend payout of SGD0.122 for the full calendar year 2023, this translates to a dividend yield of 5.76%. There was a slight to decrease to yield this calendar yar, as noted due to the rising interest costs. Given the high interest rate environment, my expected yield for this quarter would be in the range between 6.0% and 7.0%. FCT is below the range.
Website: Reasonable Dividend Yield 2023Q4
If using dividend yield of 6.0% as a benchmark, based on the dividend of SGD0.122 there is potential for FCT to see its share price drop by 3.6% to SGD2.03. With interest rates continuing to increase, the expected dividend yield required may be higer.
| Yield | Share Price | Downside |
|---|---|---|
| Current (5.76%) | 2.11 | – |
| 6.00% | 2.03 | -3.6% |
| 7.00% | 1.74 | -17.4% |
| 8.00% | 1.53 | -27.7% |
The dividend yield is thus Unfavorable.
Summary
| Metrics | Financials | Rating |
|---|---|---|
| Distribution Per Unit | -0.6% | Neutral |
| Occupancy | 99.7% | Favorable |
| Gearing Ratio | 39.3% | Neutral |
| Interest Coverage | 3.4x | Unfavorable |
| Debt Maturity Profile | 2.3 years | Favorable |
| Price to Book Ratio | 0.91 | Favorable |
| Overall | | Favorable |
Overall, the metrics indicate that is it favorable to invest in FCT this quarter, with the key change being the gearing ratio have decreased. The current short-term risk is the same as other REITs where interest rates are currently high, which continues to have an impact on DPU and also expected dividend yield. Investors will need to monitor if the risks are well managed by the management over the next few months.
FCT is currently still trading below its book value which means investors do not need to pay a significant premium. They are also paying a decent dividend yield which may be considered a safety margin and investors will need to assess their own risk profile.
Disclaimer: Not financial advice. All data and information provided on this site is for informational purposes only.
Previous Post
Website: Frasers Centrepoint Trust (SGX: J69U): 2023 Third Quarter Business Update